4. IRIS timeline
4.1. Timeline operations
IRIS operations are controlled by a timeline which contains a list of spacecraft and instrument commands. The timeline can be used by a science planner to perform the following operations:
- Point the telescope to a position on (or off) the solar disk. This position is expressed in heliocentric coordinates that are aligned with the solar E-W and S-N directions and expressed in arcseconds, with (0,0) arcsec at disk center, and positive x and y values for respectively solar west and solar north.
- Switch on or off solar tracking. When solar rotation tracking is on, the pointing of the telescope is continuously adjusted to compensate for the rotation of the Sun so that the same region on the Sun is kept within the field of view.
- Correct the pointing of the telescope to account for orbital wobble introduced by thermal flexing between the guide telescope and the main IRIS telescope. This is done by using an orbital wobble table.
- Roll the IRIS telescope from its nominal direction which is that the slit is oriented along the S-N direction on the Sun (i.e., the rotation axis of the Sun). This roll is expressed by a roll angle which is allowed to have values between -90 and 90 degrees, with negative values for the top of the slit tilted towards the eastern direction on the Sun. Whenever a roll command is performed the instrument needs to be slewed to disk center. This is enforced by the timeline tool.
- Execute (start and stop) a number of previously uploaded OBS lists. The timeline tool will keep track of which tables are onboard and determine which need to be uploaded.
Timelines are uploaded to IRIS on Monday, Tuesday, Wednesday, Thursday and Friday. The Monday through Thursday timelines cover a planning period of one full day and the Friday timeline covers three full days. For example, the Monday timeline will cover a time from 4h UTC Tuesday to 4h UTC Wednesday. The Friday timeline covers a time period from 4h UTC Saturday to 4h UTC Tuesday.
All the timelines are accessible from the IRIS Health and Safety page
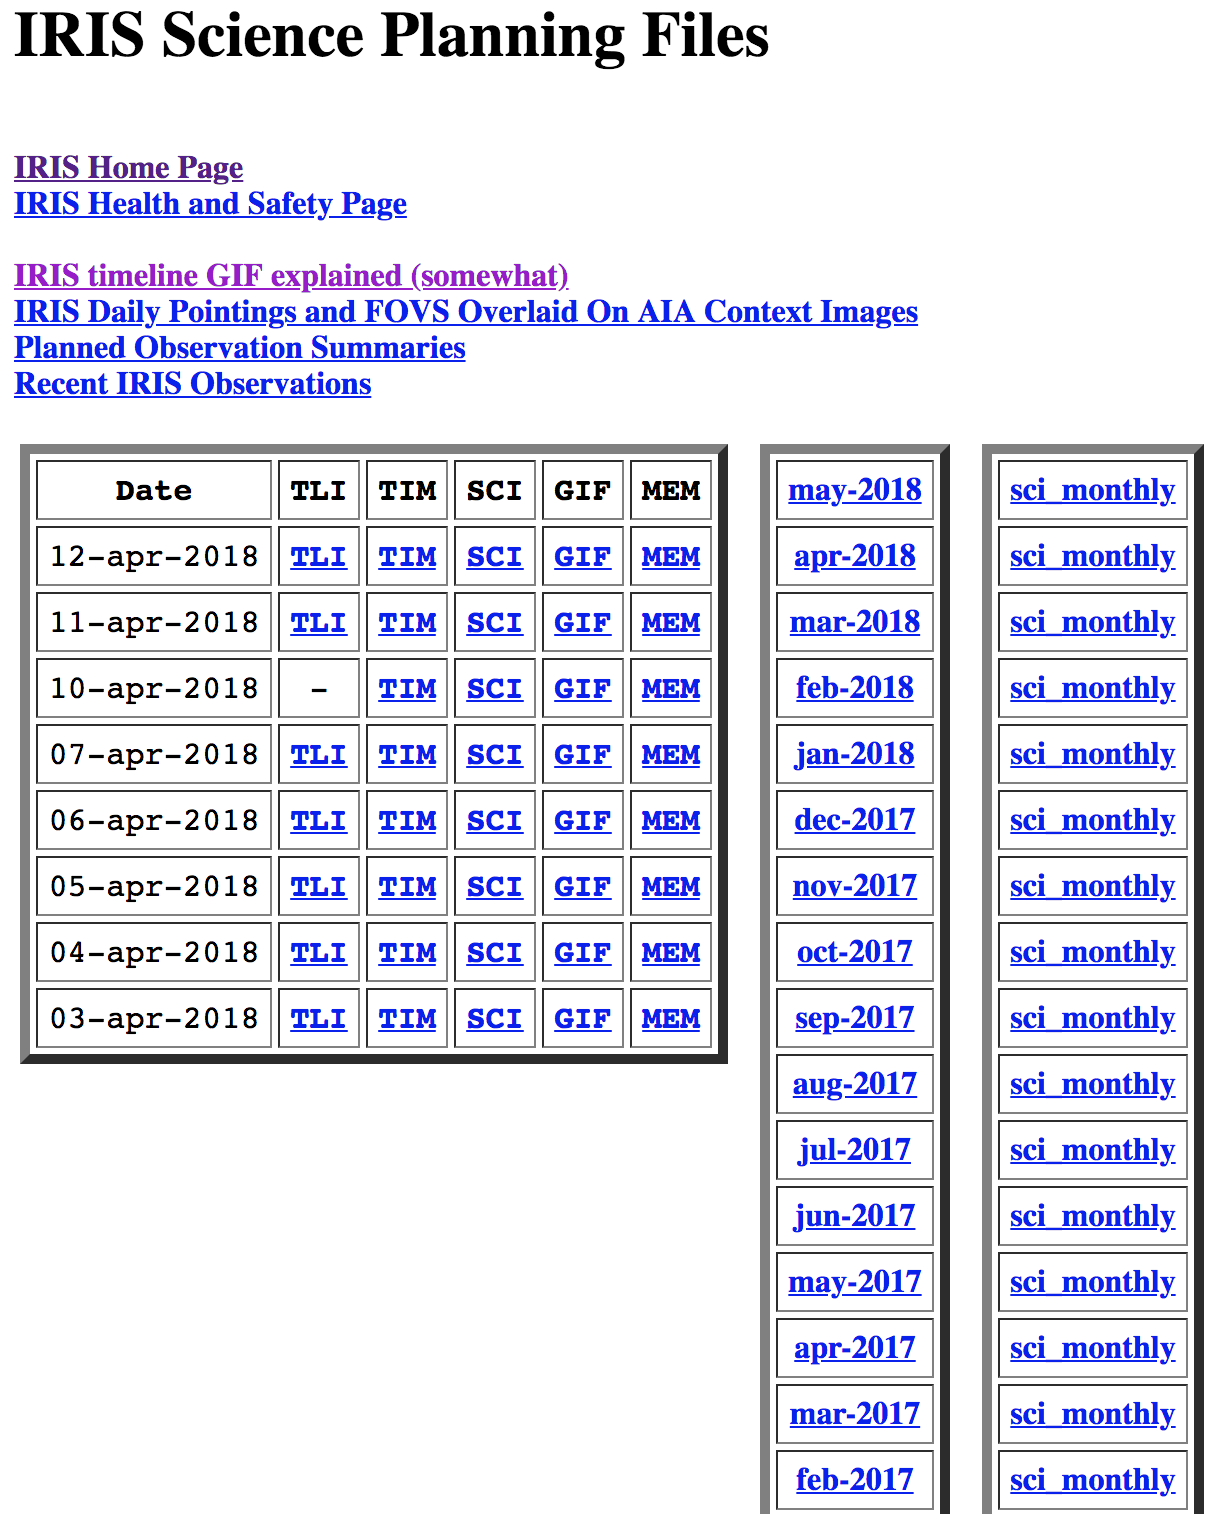
List of the timelines.
The GIF version of an IRIS timeline (below) shows graphically how the instrument activities are laid out during the day, the telemetry load, station passes, orbital anomalies (South Atlantic Anomaly – SSA, eclipses, etc). Image below provides a detailed legend for the timeline gifs.
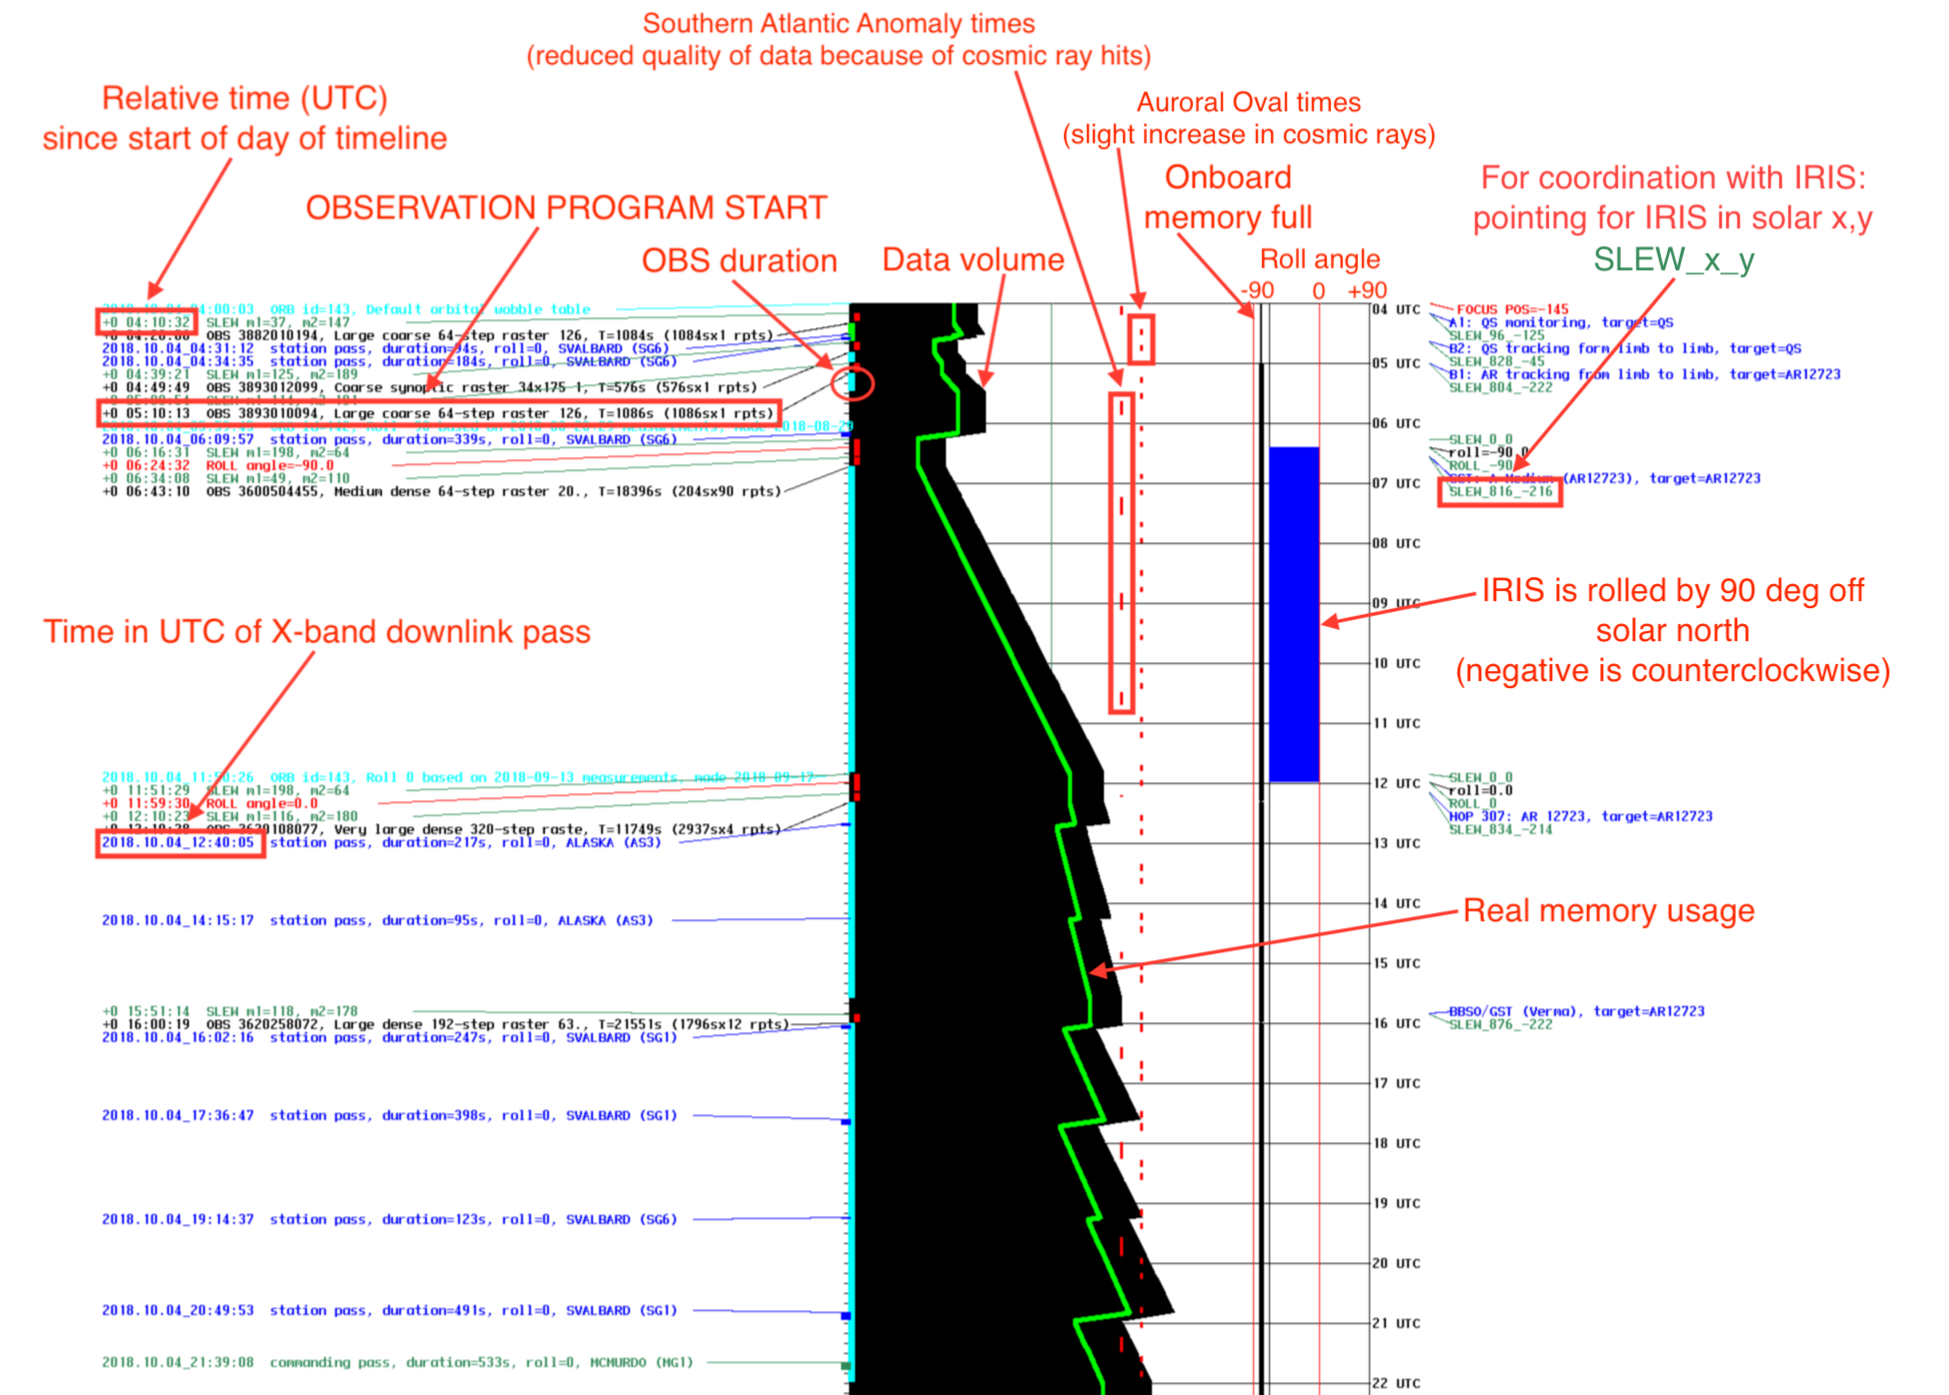
Sample of an IRIS timeline.
Next, the various types of commands that can be included in the timelines are described.