5. Plasma diagnostics using IRIS lines
Spectral lines represent the richest source of information on the physical properties of the observed plasma, which can be evaluated using plasma diagnostic tools. The most relevant diagnostics provided by the IRIS optically-thin lines are described in the following sections.
5.1. Density diagnostics
The intensity ratio of spectral lines with a different dependence on the electron number density represents a reliable density diagnostic. Ideally, lines from the same ion should be used, in order to remove the uncertainties associated with the ion fractional abundance and chemical abundance. In addition, the lines should have a similar temperature dependence, so that their ratio will be mostly independent on the plasma temperature.
The density sensitivity of line ratios from a single ion requires the existence of metastable levels (which can decay radiatively only via forbidden transitions with small A-values, see Sect. 2.3) within the ion. For an allowed line excited from the ground state, the intensity is proportional to \(N_\textrm{e}^2\), whereas for forbidden transitions, the radiative decay rate is so small that collisional de-excitation can become an important de-populating mechanism and in that case the intensity will be proportional to \(N_\textrm{e}\). Density diagnostics based on either the ratio of two forbidden transitions, two allowed transitions or an allowed and a forbidden transition can be found. The density sensitivity of two forbidden lines arises from the relative importance of collisional and radiative de-excitation. The ratio of two allowed lines could also be density sensitive if one of the lines is excited from a metastable state. For more details on density sensitive line ratios see e.g. Gabriel & Mason, 1982 and Phillips et al. 2009.
The best density-sensitive line ratios observed by IRIS is given by the intersystem (spin-forbidden) O IV transitions at 1399.77 Å and 1401.16 Å included in the Si IV 1403 Å spectral window. These lines are particularly suitable for density measurements as their ratio is largely independent of the electron temperature, and only weakly dependent on the electron distribution Dudík et al. 2014, ApJ, 780,12. The other advantage is that the lines are close in wavelength, minimizing any calibration effects.
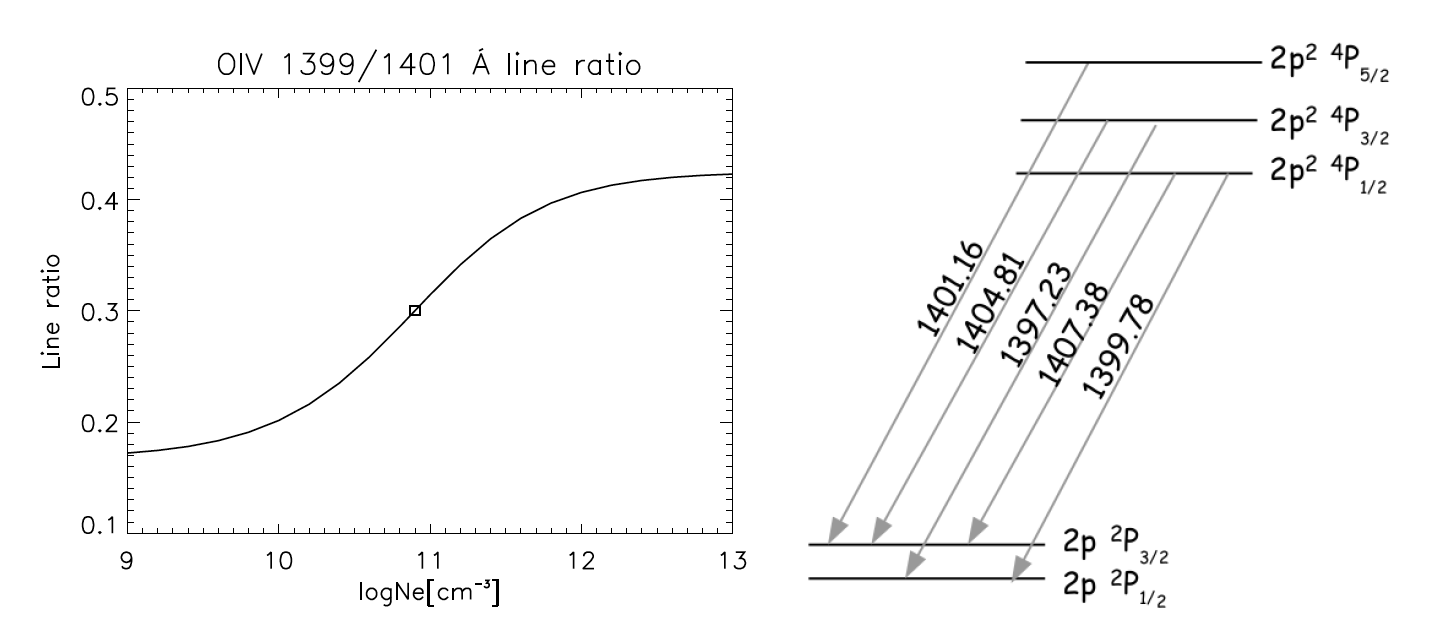
Figure 5.1. Left panel: density sensitive line ratio involving two IRIS O IV lines, calculated using theoretical emissivities from CHIANTI v.8. Right Panel: level diagrams of the O IV multiplets around 1400 Å observed by IRIS. The grey arrows indicate each forbidden transition and the wavelengths are expressed in Å.
Some useful routines for estimating the density are described below.
-
pro dens_plotter
Purpose: A widget-based routine to allow the analysis of density sensitive ratios .
Usage:
dens_plotter, ‘o_4’
Electron density diagnostics can be obtained by comparing the observed and theoretical O IV \(\lambda\) 1399.77/1401.16 ratio as a function of density, as shown in Figure 5.1.
(see also the CHIANTI user guide ) .
-
pro iris_ne_oiv
Purpose: derives the electron density from the O IV 1401.16 Å and 1399.77 Å line pairs.
See ITN 26, useful codes for a description of this routine.
Note
Note that the line intensities should be converted from DN to physical units before calculating the ratios (see Sect.4.3 and ITN 26, Calibration of IRIS observation).
Note
Most of the density diagnostic techniques assume that the emitting plasma is thermal and in ionization equilibrium, which might not always be the case in the solar atmosphere. In particular, if the plasma is outside ionization equilibrium, the estimated density may vary significantly (see e.g. Olluri et al. 2013, ApJ, 767, 43; Martínez-Sykora, Juan et al. 2016, ApJ, 871, 46 ; Dzifčáková & Dudík 2018, A&A, 610, 67).
The IRIS Si IV 1403 Å spectral window also includes the O IV line at 1404.81 Å, which is blended with the S IV transition at 1404.85 Å, and the S IV line at 1406.06 Å (Figure 5.2), which is included in selected linelists (large linelists since October 2013, flare linelists since May 2015).The S IV line ratio is sensitive to higher electron densities (up to ~1013 cm-3) compared to the O IV line ratios (up to ~1012 cm-3) and therefore is particularly useful to diagnose very high densities, which might occur during flares and energetic events. The O IV + S IV line around 1404 Å can be de-blended using the other O IV lines observed by IRIS, taking into account that the importance of the S IV to the O IV line in the blend varies with the plasma density and temperature. For instance, Polito et al. 2016, ApJ, 594, 64 used the observed \(\lambda\) 1399.77/1401.16 ratio to de-blend the O IV + S IV lines and obtain density estimates using the S IV \(\lambda\) 1404.85/1406.06 ratio for different solar features.
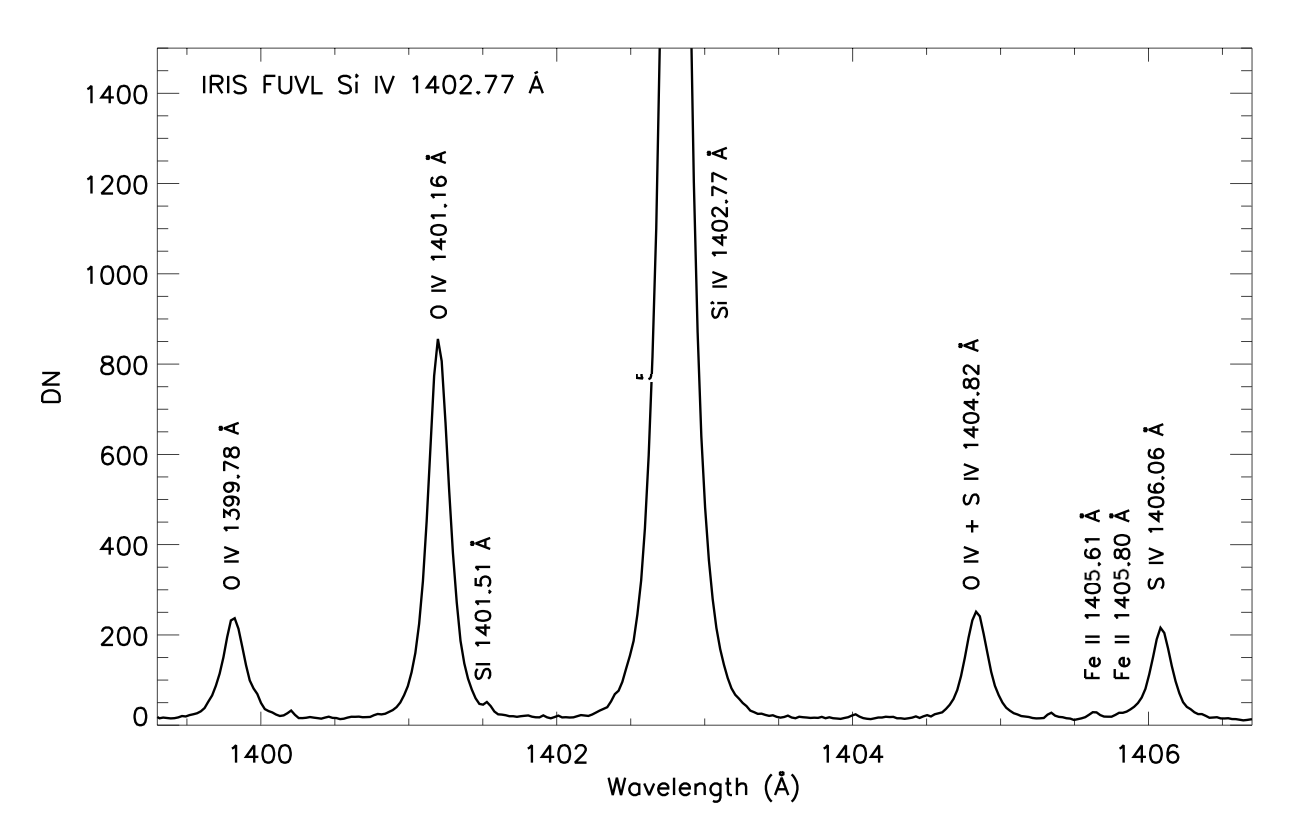
Figure 5.2: Example of a IRIS spectrum around 1400 Å showing the O IV and S IV multiplet and the O IV + S IV blend around 1404.82 Å. The strongest photospheric lines visible in this spectral window (S I and Fe II) are also shown. Adapted from Polito et al. 2016, ApJ, 594, 64.
Line ratios involving an O IV forbidden transition and a Si IV allowed transition have been sometimes used to provide electron densities during solar flares and transient brightenings (e.g. Cheng at al., 1981, ApJ, 248, 39 ; Peter et al. 2014, Sci, 346, 315 ; Doschek et al. 2016, ApJ, 832, 77). The validity of using the O IV to Si IV ratios has been debated because these ratios tend to give very high densities compared to the more reliable ones obtained from the O IV ratios alone (see Hayes & Shine, 1987, ApJ, 312, 943). In particular, Judge, 2015, ApJ, 808, 11 recalled several issues related to the use of this ratio, including the fact that O IV and Si IV are formed at quite different temperatures in equilibrium and thus a change in their ratio could also imply a change in the temperature rather than in the plasma density. In addition, the chemical abundances of O and Si are not known with accuracy and could be varying during the observed events. Further, these ions show a very different response to transient ionization because of their different formation processes. Finally, as mentioned in Section 2.2, it should be noted that taking into account the effect of high-densities on the ionization balance will cause the fractional ion abundances of O IV and Si IV to depart significantly from the values calculated at low densities, i.e. in CHIANTI (Polito et al. 2016, ApJ, 594, 64 ; Young et al. 2018, ApJ, 857, 5).
Nevertheless, as pointed out by e.g. Doschek et al. 2016, ApJ, 832, 77 and Young et al. 2018, ApJ, 857, 5, one limitation in the use of the O IV lines is that they are normally observed to be extremely weak (the O IV 1399.7 line in particular). In that case, the Si IV to O IV ratio might still be used to provide some estimate for the electron density, keeping in mind the issues described above.
Note
The O IV lines are partially blended with some photospheric lines, especially during the impulsive phase of flares (e.g. Polito et al. 2016, ApJ, 816, 89). The strongest of those lines is the S I neutral line at 1401.51 Å on the red wing of the O IV 1401.16 Å line. Most of the times, the S I narrow line can be separated from the broad neighbor O IV line and used to perform wavelength calibration (see Sect. 4.2). Further, the photospheric Fe II lines at 1405.61 Å and 1405.80 Å are blended with the S IV 1406.06 Å line. It is important to remove these blends before measuring the line intensities and use their ratios to estimate the density.
5.2. Plasma motions: Doppler shifts and non-thermal line widths
IRIS spectral lines provide useful diagnostics of plasma motions. In sec. 4.1 we briefly discuss the line fitting of IRIS spectral lines, when they can be approximated with Gaussian profiles. The Gaussian fit provides the line center (i.e., the line Doppler shift, when compared with the line rest wavelength), and line width.
Doppler shift of a spectral line indicates that the emitting plasma has a velocity \(v\) along the line-of-sight either toward/away from the observer, causing a blueshift/redshift (\(\Delta \lambda / \lambda_{0} = v / c\)). Fig. 5.3, 5.4, 5.5, show some examples of velocity maps obtained from IRIS observations of a variety of targets (coronal jets, post flare loops, flare loops).
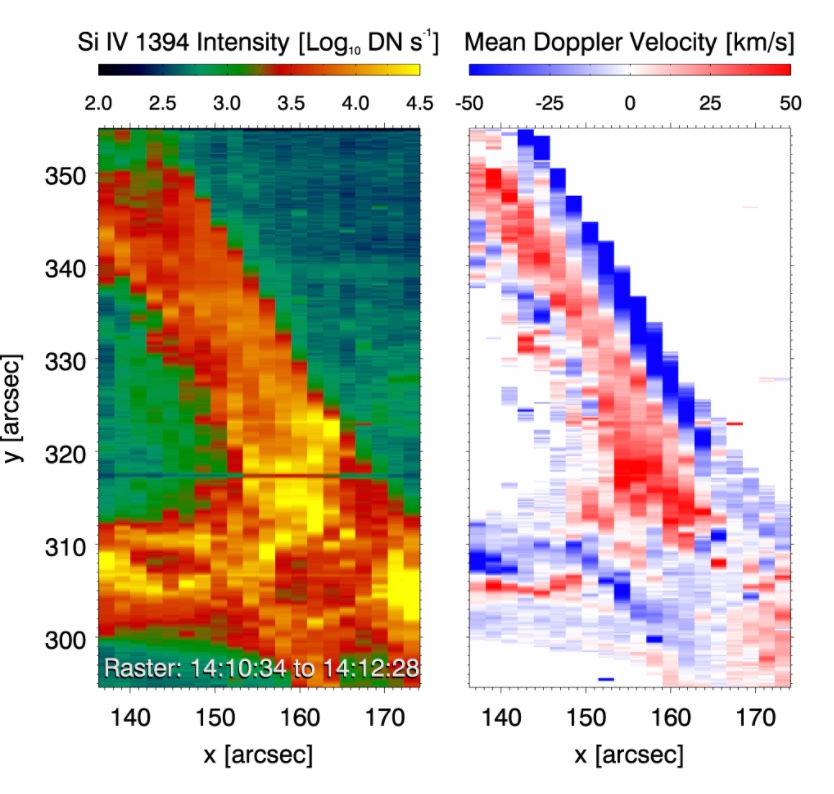
Figure 5.3. Total intensity (left panel) and Doppler velocity (right panel) in the Si IV 1394Å line for a coronal jet observed by IRIS. The velocity map suggests helical motions of the jet plasma (from Cheung et al., 2015, ApJ, 801, 83).
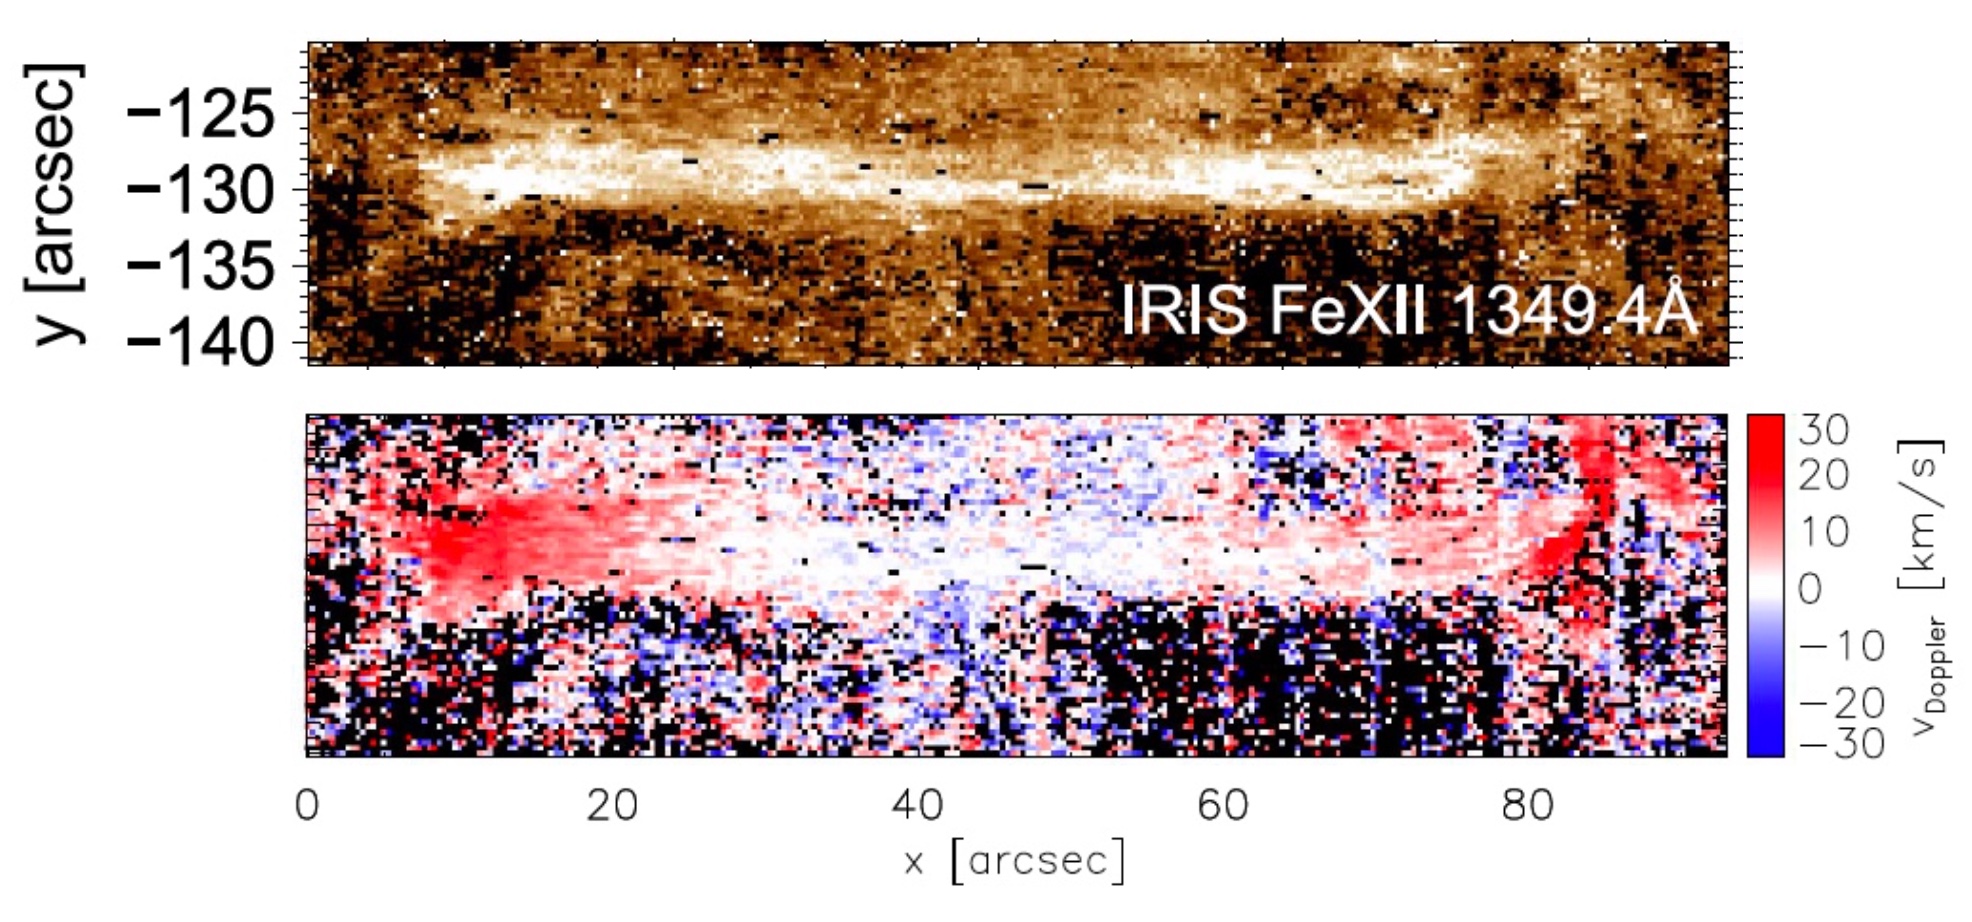
Figure 5.4. Fe XII 1349.4 Å line intensity (top) and Doppler shift (bottom) map for post flare loops ( from Testa et al., 2016, ApJ, 827, 99).
The spectral line width provides additional diagnostics of plasma motions. As discussed in sec. 4.1, intrinsic thermal broadening (\(w_{th}^2 = 8ln(2)\lambda k_{B} T/ m_{ion}c\) if expressed as FWHM, where \(k_{B}\) is the Boltzmann constant, \(T\) is the temperature of the emitting plasma, and \(m_{ion}\) is the mass of the ion emitting the line), instrumental broadening (\(w_{instr}\)), and the so-called “non-thermal line width” (\(w_{nth}\)) contribute to the observed line width \(w\):
The non-thermal line width \(w_{nth}\) (i.e., broadening in excess of the thermal and instrumental brodening) can be caused by several different processes, including for example fine scale unresolved flows, waves, turbulence (see e.g., Chae et al., 1998, 505, 957 and De Pontieu et al., 2015, 799, 12 , Testa et al., 2016, ApJ, 827, 99 for a discussion). Some examples of thermal FWHM (calculated at the peak formation temperature of the ions \(T_p\), without taking into account the instrumental width) for some of the IRIS lines discussed in this tutorial are reported in the following table:
| Line | Wavelength (Å) | log Tp [K] | FWHM (Å) |
|---|---|---|---|
| Si IV | 1402.77 | 4.9 | 0.05 |
| O IV | 1401.16 | 5.15 | 0.09 |
| Fe XII | 1349.40 | 6.2 | 0.16 |
| Fe XXI | 1354.08 | 7.05 | 0.43 |
Note
A large number of papers in the literature analyze and discuss the “non-thermal line width” properties of solar emission lines. However we note several different definitions are used by different authors. In particular, some authors define \(w_{nth}\) as the FWHM of the line (\(FWHM = 2 \sqrt{2 \ln{2}} \sigma\), where \(\sigma\) is the Gaussian \(\sigma\)), others refer to the \(w_{1/e}\) (\(w_{1/e} = \sqrt{2} \sigma\)), while others might use the Gaussian \(\sigma\).
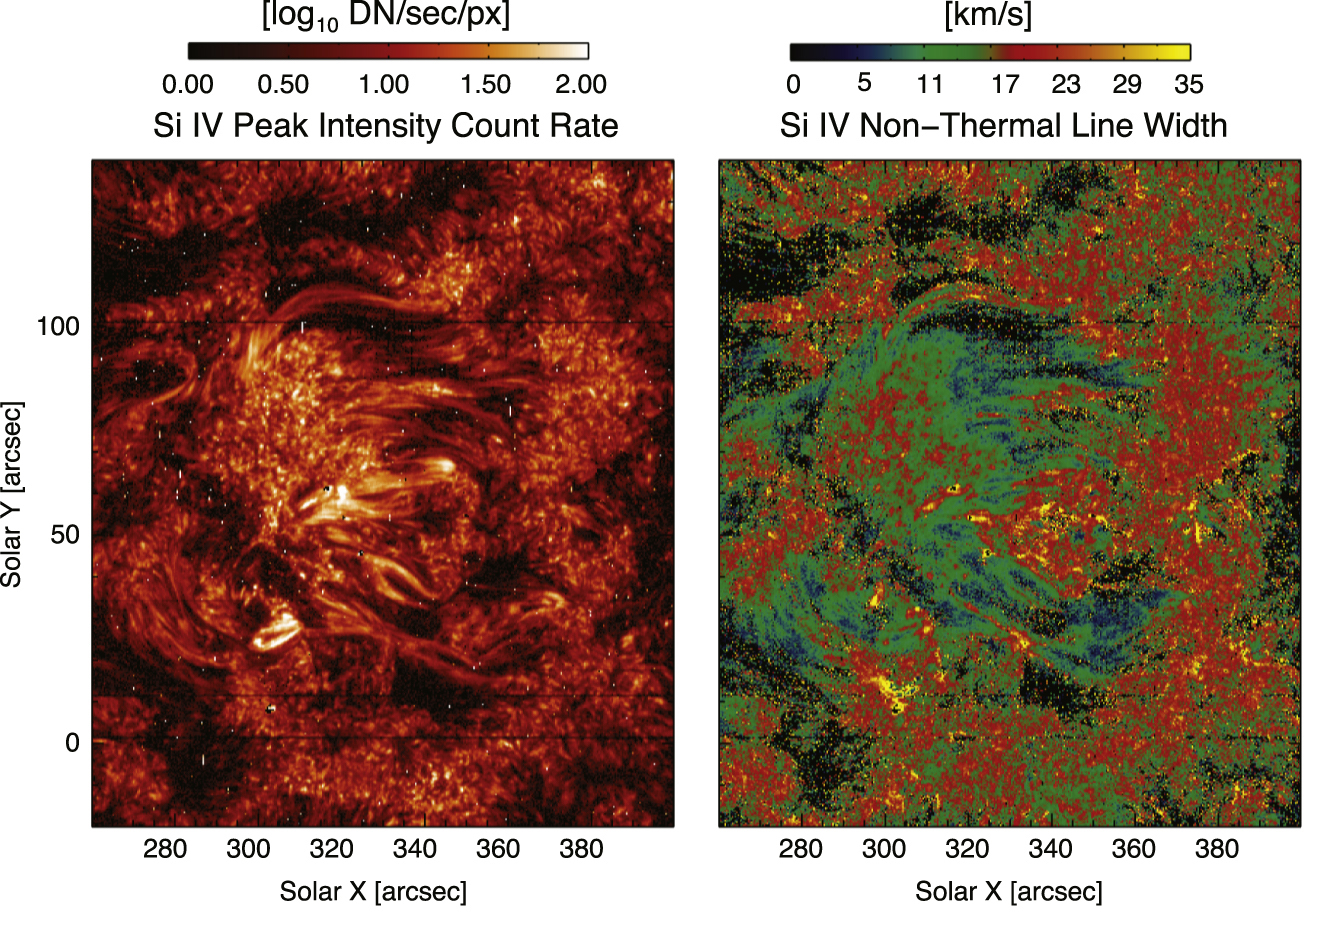
Figure 5.5. Si IV 1402.77Å peak line intensity (left panel) and non-thermal line width (right panel) map for an active region (from single Gaussian fits to the observed line profiles — see sec. 4.1; in De Pontieu et al., 2015, 799, 12).
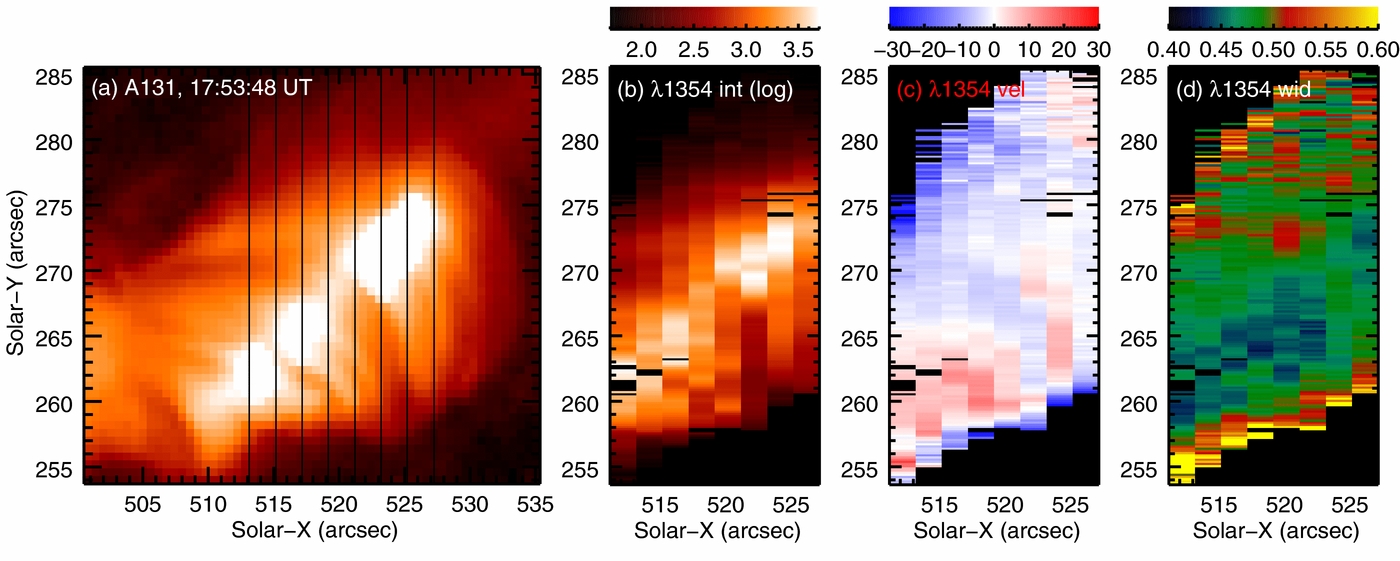
Figure 5.6. Fe XXI 1354.07Å line intensity map for a flare (second panel), compared with emission observed by SDO/AIA in the 131Å passband which is also sensitive to FeXXI emission. Maps of Doppler shifts (third panel) and line width (fourth panel) of the IRIS FeXXI 1354.07Å line are also shown (from Young et al., 2015, ApJ, 799, 218).
Another useful spectroscopic diagnostics is provided by possible line asymmetries. Several approaches can be used to quantify the degree of asymmetry in line profiles, such as, for instance, determining the “red-blue asymmetry” of the line (De Pontieu et al., 2009, 701, 1 , Polito, Testa & De Pontieu 2019, ApJL, 879,17): the blue wing emission integrated over a narrow velocity range is subtracted from that over the same range in the red wing. The range of integration is then sequentially stepped outward from the centroid to build an RB asymmetry profile as a function of offset velocity (De Pontieu et al., 2009, 701, 1). This analysis can provide diagnostics of faint flows, and diagnose their spatial and temporal distribution. In Figure 5.7 we show an example of these line asymmetries observed with IRIS, in this case used to diagnose and study type II spicules.
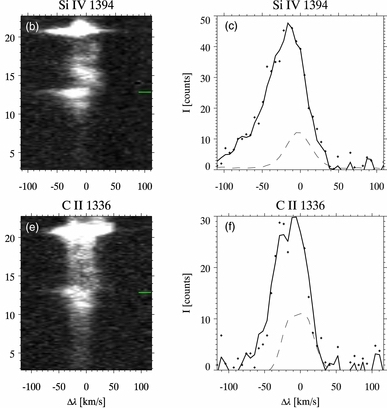
Figure 5.7. Examples of Si IV 1394Å and CII 1336Å line profiles showing asymmetries, produced by type II spicules (from Rouppe van der Voort et al., 2015, ApJL, 799, 3).
5.3. Opacity using ratio of Si IV lines
IRIS observes two Si IV lines at 1393.75 Å and 1402.77 Å whose ratio can be used to test whether the ion is formed under optically thin or thick conditions. In particular, a ratio close to 2 is compatible with the lines being optically thin (see e.g., Peter et al. 2014, Science, 346, 315 and Yan et al. 2015, ApJ, 811. 48). However, it is possible that the lines are optically thick and still have a ratio of about 2, so one cannot use the line ratio to conclusively state that the lines are optically thin.
While the 1402.77 Å line is largely free of blends, the 1393.75 Å line is blended with a Ni II 1393.33 Å line at around ~90 km/s from at the Si IV core and with an unidentified transition, which is only visible during flares. These blends should be removed from the line intensity before calculating the \(\lambda\) 1393.755/1402.770 ratio.