5. Calibration of IRIS Observations
5.1. Wavelength Calibration
The wavelength calibration is automatically performed to the best of current knowledge. This is accurate to only a few pixels, and should be manually checked. There are several photospheric spectral lines that can be used for accurate wavelength calibration, most notably the Ni I 279.9474 nm line in the NUV and the O I 135.560 nm line in the FUV.
Note
The IRIS automatic wavelength calibration is based on these lines averaged over the entire slit. The slit may cover regions of significant line-of-sight flows, such as flux emergence in active regions, and thus these photospheric lines may not necessarily be at their nominal rest wavelengths as assumed by the automatic calibration. In such cases, the user is advised, again, to perform manual wavelength calibration by avoiding such regions under the slit coverage.
A detailed discussion of the wavelength calibration steps for IRIS and how to use them on data can be found in IRIS Technical Note 20.
5.2. Radiometric Calibration
Note
The throughput calibration as a function of wavelength in the FUV passband is subject to significant uncertainty. This uncertainty can significantly impact studies of how the line ratio between Si IV 1394 and Si IV 1402 varies with time throughout the mission.
Note
Due to significant uncertainties in the reference calibration data (from SORCE/SOLSTICE and TIMED/SEE) for the Si IV part of the FUV window, the wavelength-dependent correction for the effective area (for the range between 1388Å to 1408Å) is replaced by a wavelength-independent correction. This decision helps to address the Si IV 1393.8Å/1401.8Å line ratio issue (seen to progressively change with time when using previous versions of the radiometric calibration) preliminarily but with a caveat, i.e., the accuracy of this calibration is likely not sufficient to allow studies of the line ratio of Si IV on long timescales. Differences seen in Si IV ratio of network and internetwork regions might suggest a bias in the FUV background.
The IRIS data are given in counts or Data Number units (DN). To convert these to a flux in physical units (e.g. erg s-1 sr-1 cm-2 Å-1) one must perform a radiometric calibration. The calibration data is included in the IRIS solarsoft branch, and can be read into an IDL structure with the iris_get_response routine:
IDL> iresp = iris_get_response(time)
where time is a string with the time of the observations (compatible with anytime). The output has the following structure:
IDL> help, iresp, /str
DATE_OBS        STRING    ''
LAMBDA          FLOAT     Array[3601]
AREA_SG         FLOAT     Array[3601, 2]
NAME_SG         STRING    Array[2]
DN2PHOT_SG      FLOAT     Array[2]
AREA_SJI        FLOAT     Array[3601, 4]
NAME_SJI        STRING    Array[4]
DN2PHOT_SJI     FLOAT     Array[4]
COMMENT         STRING    ''
VERSION         STRING    '003'
VERSION_DATE    STRING    '20150331'
where AREA_SG and AREA_SJI are the effective areas (in cm-2) as a function of wavelength (LAMBDA) respectively for the spectrograph and slit-jaw camera. The DN2PHOT tags give the conversion from DN counts to photons.
Note
By default, iris_get_response will apply the most up to date calibration, which is recommended. It is also possible to specify a specific calibration version through the version keyword. With early versions the DN2PHOT tags are not present.
To convert the spectral units from DN to flux one must do the following:
where \(E_\lambda \equiv h \cdot c / \lambda\) is the photon energy (in erg), \(\mathrm{DN2PHOT\_SG}\) is the number of photons per DN (get from iris_get_response), \(A_\mathrm{eff}\) is the effective area (in cm-2), \(\mathrm{Pix}_{xy}\) is the size of the spatial pixels in radians (e.g. multiply the spatial binning factor by \(\pi/(180\cdot 3600 \cdot 6)\)), \(\mathrm{Pix}_{\lambda}\) is the size of the spectral pixels in Å, \(t_\mathrm{exp}\) is the exposure time in seconds and \(W_\mathrm{slit}\) is the slit width in radians (\(W_\mathrm{slit}\equiv \pi/(180\cdot 3600 \cdot 3)\)).
A detailed discussion of the radiometric calibration steps for IRIS and how to use them on data can be found in IRIS Technical Note 24.
Note
The exposure time \(t_\mathrm{exp}\) can be different for each exposure in the same sequence, when Automatic Exposure Control (AEC) is switched on. This is the default for most active region observations, although different exposures are only used in extreme cases when very bright phenomena can lead to CCD saturation (e.g. a flare). The level 2 FITS headers have only one value for the exposure time (the value without AEC). The sequence-dependent exposure times are available in the auxiliary metadata in the FITS files (see Level 2 chapter), with table index given by EXPTIMEF, EXPTIMEN, and EXPTIME for FUV, NUV, and slit-jaw, respectively.
5.3. Background in FUV data
FUV spectra with longer exposure times show a faint background most likely caused by a light leak from wavelengths significantly longer than the FUV. This means that the light leak is absorbed at a different CCD depth than the FUV light and thus does not show the same CCD flat-field (which for the FUV is quite prominent and dominated by the CCD annealing pattern). The light leak effectively acts as an extra “dark current” although it appears to have varying intensity levels for different pointings on the Sun. This background has been characterized and is automatically removed by iris_prep, and therefore subtracted in level 1.5 and level 2 data.
5.4. Coalignment between channels and SJI/spectra
In level 2 data the slit-jaw images from different filters and detectors are automatically co-aligned. This automatic approach is not failsafe, especially for observations with very short exposure times. Therefore, for precise analysis one should always check if the images match. There are two spectral marks on the slit that are called fiducials and block the light from entering. They are used for calibration, and their position should match between slit-jaw images. With smaller fields of view only one of the fiducials is visible.
Note
The position of the slit in different slit-jaw channels is not necessarily the same. Depending on the observing program, different slit-jaw filters may be exposed at different parts of a raster. This is particularly true for two or four step rasters. In such cases the alignment should have in mind the header coordinates from CRPIX and CRVAL.
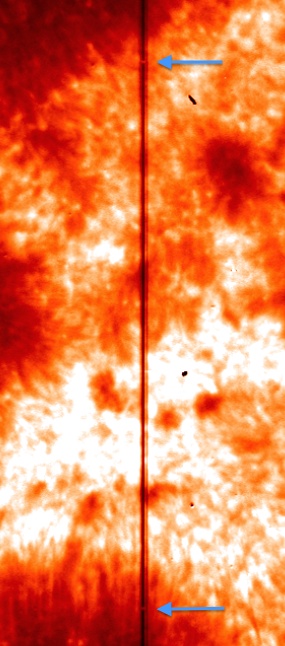
Position of fiducial marks on a slit-jaw image.
As in the slit-jaw images, so too the NUV and FUV spectrograms are co-aligned in level 2 data. These too should be checked for the alignment, both between FUV, NUV and slit-jaws. In spectrograms the fiducial marks appear as solid black lines along the wavelength direction, and they should appear in the same exact spatial position for the NUV and FUV channels.
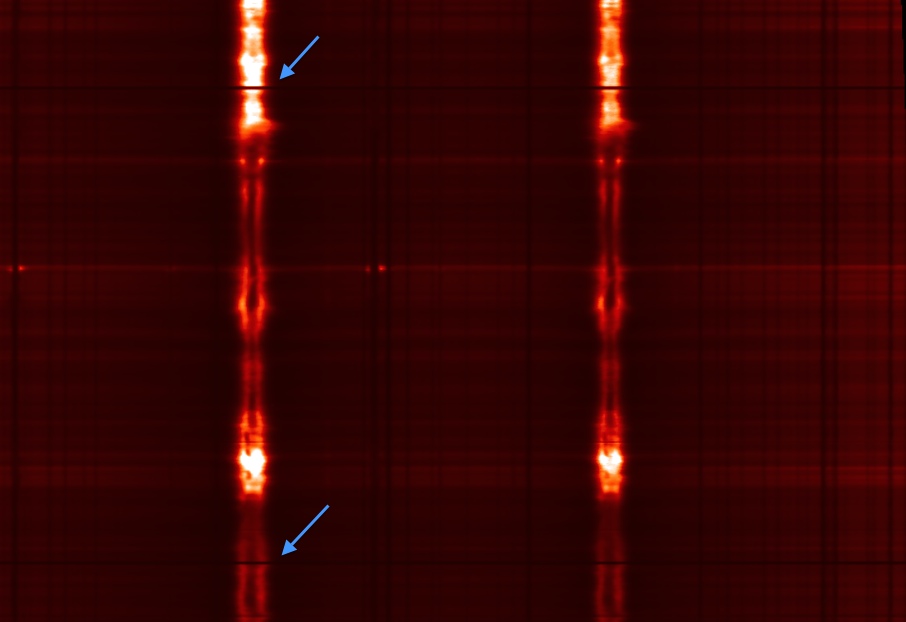
Position of fiducial marks on an NUV spectrogram.
Any misalignment can be corrected for when using option yshift in iris_make_fits_level3. This option can be set to a 3-element array with the shift to be applied in the y direction to the raster files, where yshift=[fuv1, fuv2, nuv] e.g.:
IDL> iris_make_fits_level3, f, [0, 3, 6], yshift=[2, 2, 1]