1. Introduction
The very high temperatures (millions of Kelvin (K)) reached in the solar atmosphere mean that the chromosphere, transition region (TR) and corona strongly emit at UV and X-ray wavelengths. In particular, the contribution to the UV spectrum from different layers of the solar atmosphere can be summarized as follows:
- EUV (~100-1200 Å): mainly from the hot corona and TR
- FUV (~1200-2000 Å): mainly from TR & chromosphere
- NUV (~2000-3900 Å): mainly from chromosphere & photosphere
In contrast to the dense chromosphere (with electron number densities \(N_\textrm{e}\) of about \(10^{10.5}-10^{14} cm^{-3}\), e.g. Avert & Loser 2008, ApJS, 175, 229 ), the tenuous corona (with \(N_\textrm{e}\) ~ \(10^8 cm^{-3}\) , e.g. Warren & Brooks, 2009, ApJ, 700, 1 ) is mostly optically-thin to visible, UV and X-ray radiation, which means that photons at these wavelengths will not be absorbed while passing through the coronal plasma and will eventually reach the observer. The focus of this tutorial is on lines formed under these optically-thin conditions, whereas the analysis of optically thick lines observed by IRIS is discussed in detail in ITN 39.
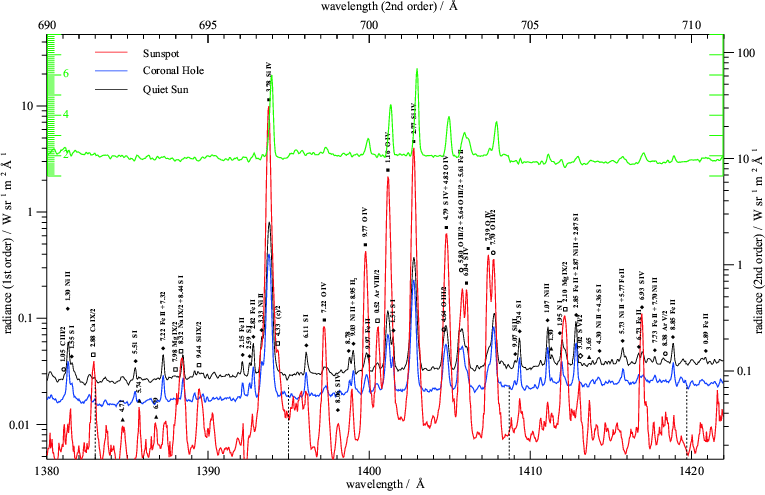
Figure 1.1: Example of SUMER full-disk spectral atlas for the average quiet Sun (black), an equatorial coronal hole (blue), and a sunspot (red) in the spectral interval 1380-1422 Å. The figure shows emission lines superimposed on a continuum emission. All the identified lines are labeled in the spectrum. From Curdt et al. 2001, A&A, 375, 591.
At UV and X-ray wavelengths below 1600 Å, the solar spectrum is dominated by emission lines and continuum background emission (see Fig. 1.1). This latter is mainly due to:
- Free-free, or Bremsstrahlung emission: produced by the deceleration of a free electron in the Coulomb field of an ion.
- Free-bound emission: a free electron is captured by an ion into a bound state.
Emission lines result from the spontaneous decay of an excited electron from one energy level to a lower energy level within an atom or an ion, the excess energy being carried on by a photon. The details of line formation will be discussed in Section 2. An introduction to the most important IRIS lines which can be formed under optically thin conditions is presented in Section 3. Section 4 will introduce some of the tools to analyze the spectra of these lines whereas in Section 5 we will describe in details some of the diagnostics that can be obtained from them.