3. Optically-thin lines observed by IRIS
The IRIS spectra contain several lines which can be formed under optically thin conditions (e.g., ITN 26 http://iris.lmsal.com/itn26/). In Figure 3.1 we show a reference spectrum on which we highlight (blue boxes) the position of some of the strongest and most interesting optically thin lines observable with IRIS.
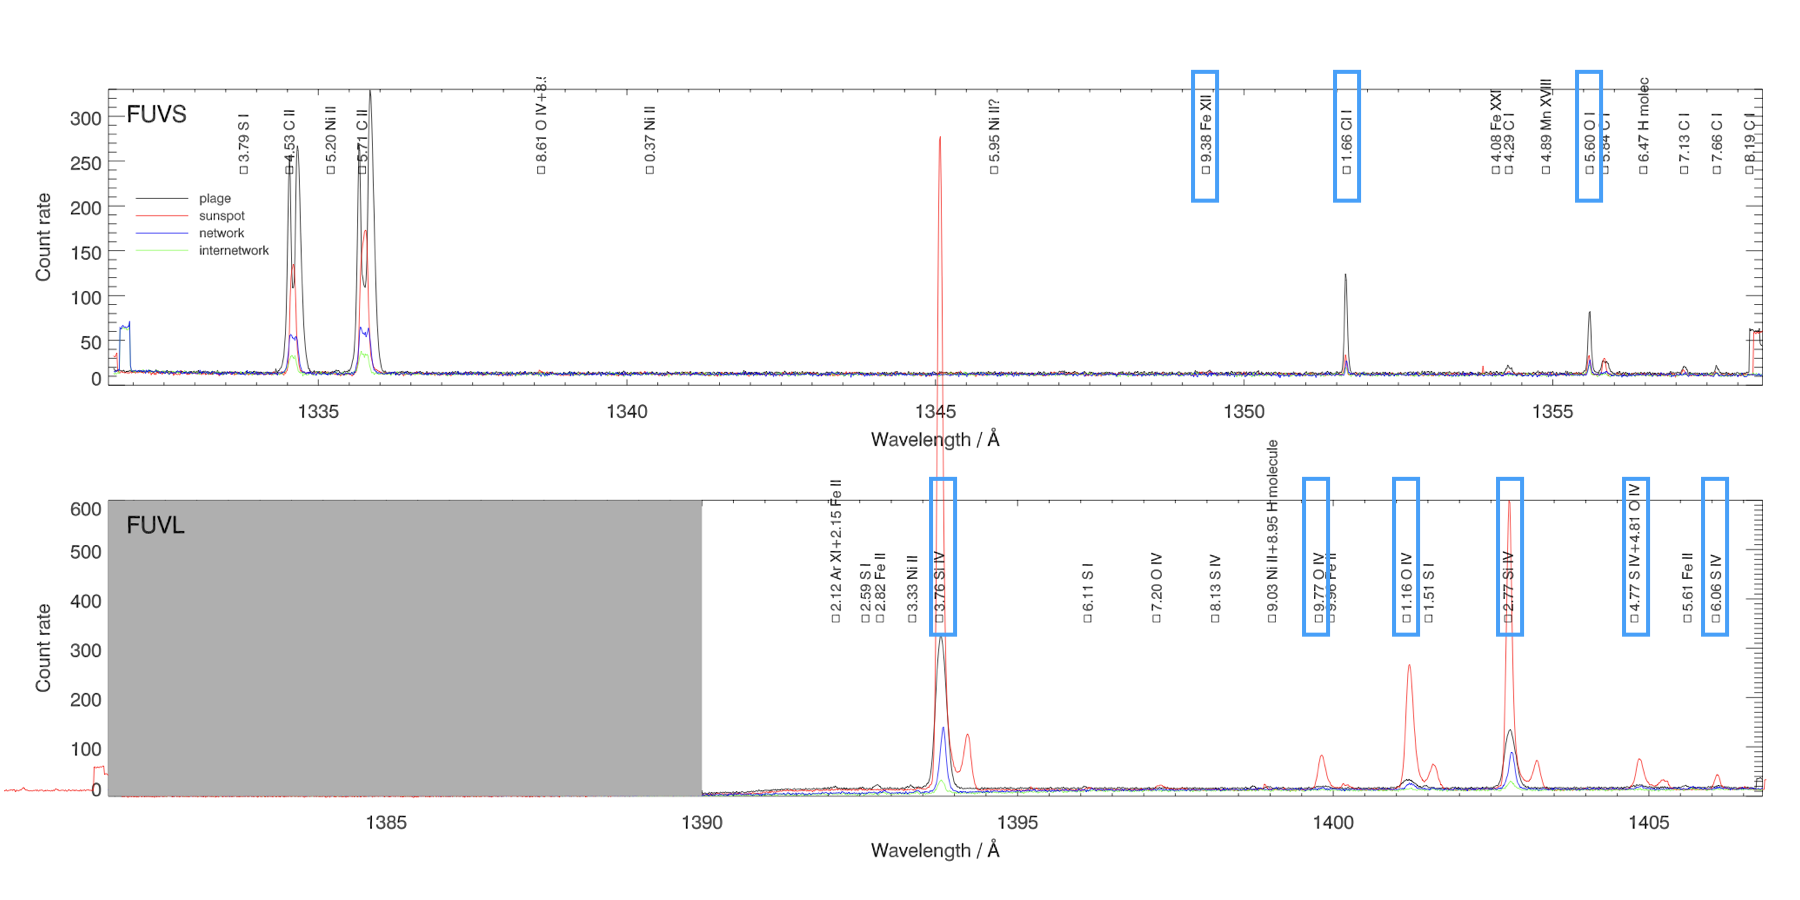
Figure 3.1: IRIS reference spectra in the FUV bands, in which position of the most prominent optically thin lines are highlighted in blue.
In the following sections, we provide an overview of the strongest optically-thin lines observed by IRIS, and their diagnostic potential. We note that some of these lines (e.g. Si IV) can also be formed under optically thick conditions.
3.1. O I
Recent studies of the mechanism of formation of the IRIS OI 1355.598Å emission line (` from Lin & Carlsson 2015, ApJ, 813, 34) have shown that this line is mostly formed under optically thin conditions formed throughout the whole chromosphere. Lin & Carlsson (2015) also show that its Doppler shift is a good diagnostic of the velocity averaged over its formation region (see Figure 3.2).
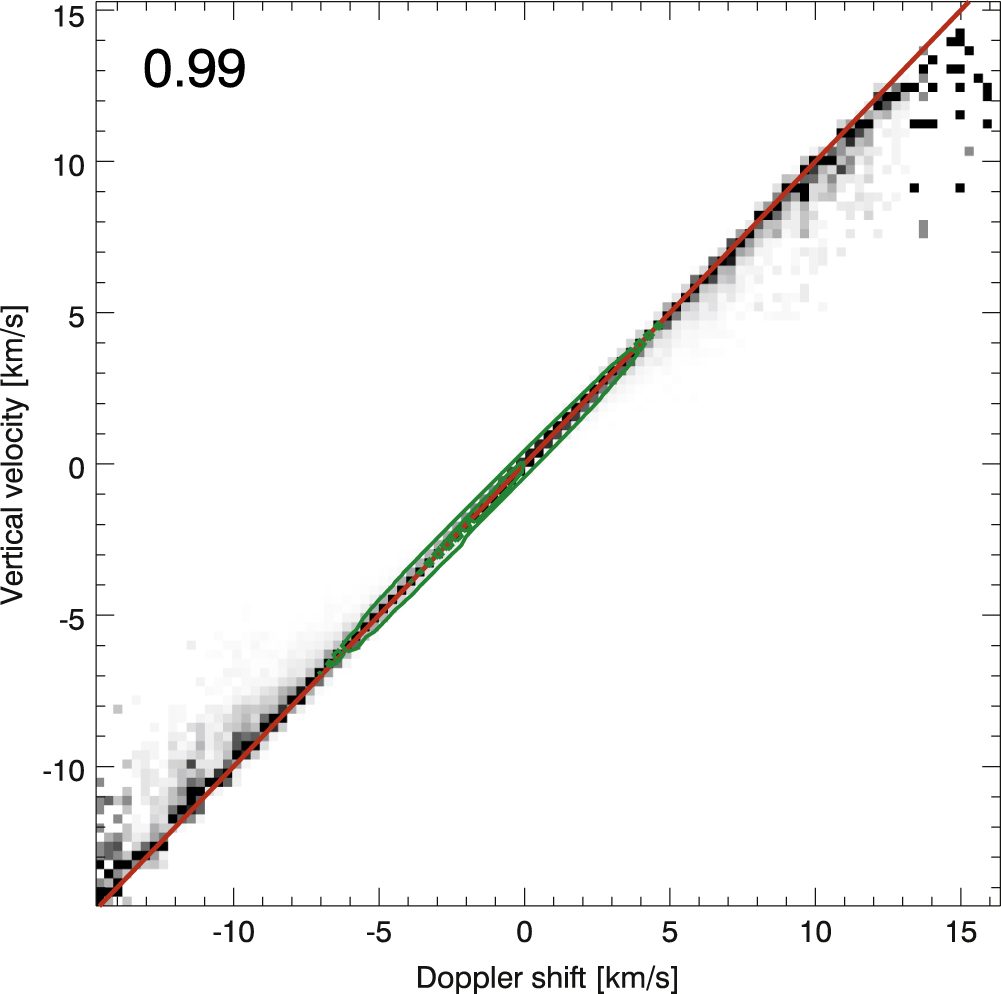
Figure 3.2. Correlation between O I 1355 Doppler shifts and velocity of plasma emitting this line, from Bifrost simulations ( Lin & Carlsson 2015, ApJ, 813, 34 ).
Being optically thin, the line width of the IRIS OI 1355Å line provides a good diagnostic of non-thermal motions in the chromosphere (e.g., Chae et al. 1998, ApJ, 505, 957).
3.2. Cl I
The formation of the IRIS Cl I 1351.657Å line is affected by a fluorescence effect driven by the C II 1335.7Å line (Shine 1983, ApJ, 266, 882). The IRIS Cl I 1351.657Å line is very prominent in on-disk observations, and also in the so-called IRIS bombs (e.g., Peter et al. 2014, Science, 346, 315). (See also, e.g., Ayres et al. 2003, ApJ, 583, 963, for stellar observations of this Cl I 1351 line.)
3.3. Si IV
The Si IV lines at 1393.755Å and 1402.770Å are, for many targets, some of the strongest lines in the IRIS FUV spectra.
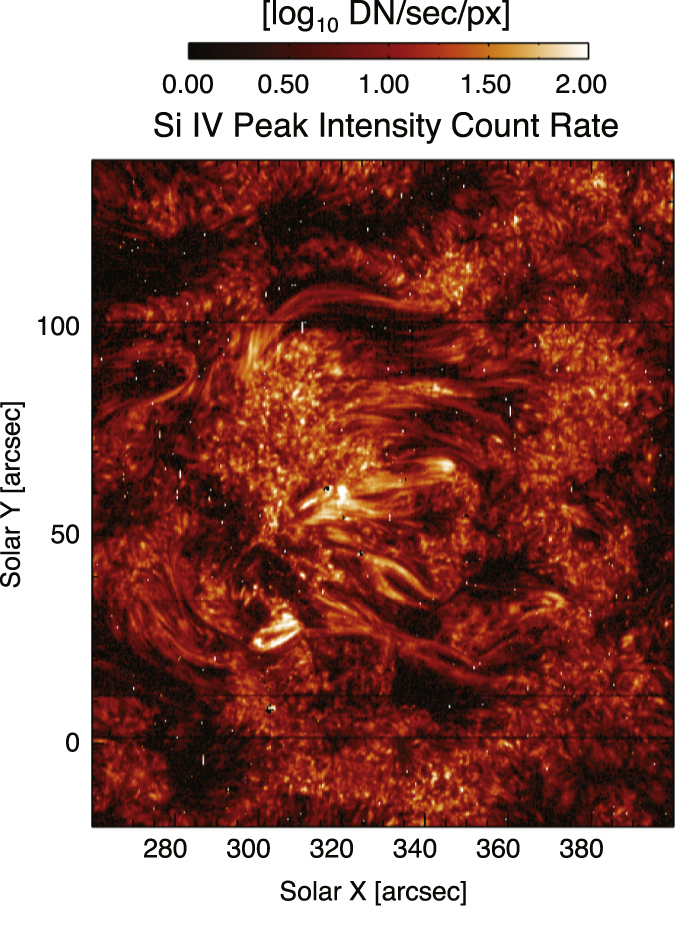
Figure 3.3. Si IV 1402.77Å peak line intensity map for an active region (from single Gaussian fits to the observed line profiles — see sec. 4.1; De Pontieu et al., 2015, 799, 12).
They are often optically thin, and provide very good diagnostics of transition region structuring and dynamics. However, in some cases, a departure from optically thin regime can be observed for these Si IV lines. The 1393.755Å/1402.770Å intensity ratio is a diagnostic for opacity effects (e.g., Peter et al. 2014, Science, 346, 315, see also Sect. 5.3): a ratio ~2 can indicate that the lines are optically thin, while values different than 2 may indicate some degree of optical thickness.
The Si IV 1402.770Å line is typically unblended. The Ni II (1393.330Å, at ~90 km/s from the Si IV 1393Å line core), and CO (1393.51Å) are possible blends for the Si IV 1393.755Å line.
The ratio of Si IV to OIV has sometimes been used as density diagnostic (e.g. Young et al. 2018). See Sect. 5.2 for further discussion.
3.4. O IV, S IV
Three O IV emission lines (1399.780Å, 1401.157Å, 1404.806Å) can be observed with IRIS, and provide useful diagnostics of e.g., plasma densities (see e.g., Dudik et al. 2014, ApJL, 780, 12 ). The O IV 1404.806Å line is however blended with a S IV line (at 1404.808Å) formed at a similar temperature. The intensity of the S IV 1404.808Å line can be estimated by measuring another S IV unblended line at 1406.016Å (see also Sect. 5.1).
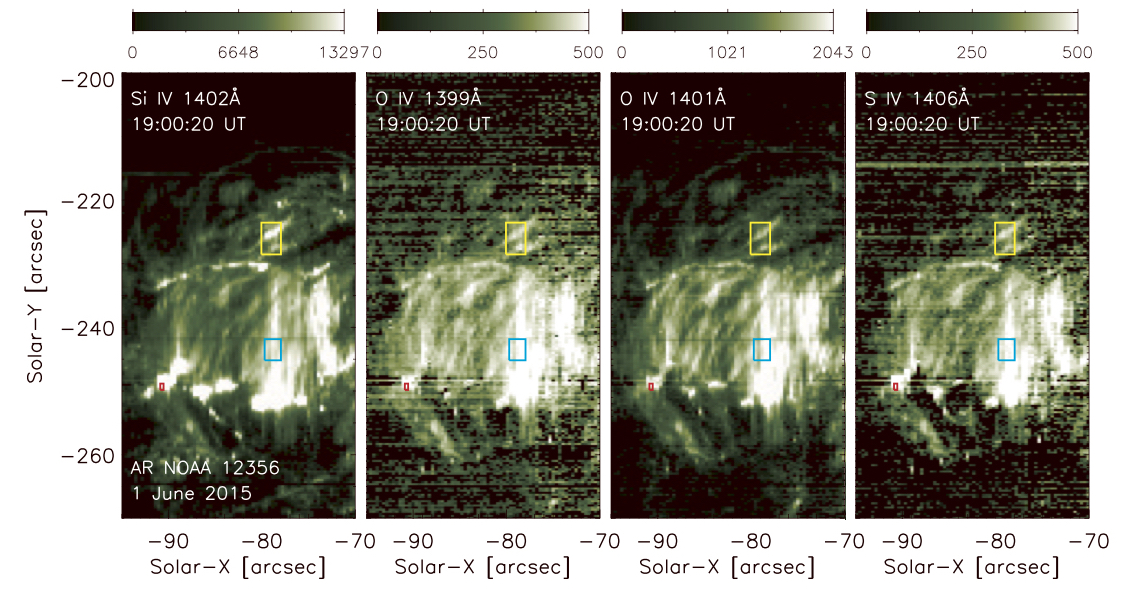
Figure 3.4. Intensity map for an active region for 4 different optically thin transition region lines observed with IRIS: Si IV 1402Å, O IV 1399Å, O IV 1401Å, S IV 1406Å ( Polito et al., 2016, A&A, 594, 64).
The IRIS O IV lines, when compared with the nearby Si IV 1402.77Å line, are weaker than predicted by equilibrium models. The discrepancy is due to several possible effects:
- non-equilibrium ionization (e.g., Olluri et al. 2013, ApJ, 767, 43, Martinez-Sykora et al. 2016, ApJ, 817, 46)
- density effects (e.g., Peter et al. 2014, Science, 346, 315 , Doschek et al., 2016, ApJ, 832, 77)
- non-Maxwellian electron distribution (e.g., Dudik et al. 2017, ApJ, 842, 19)
3.5. Fe XII
The IRIS 1349.400Å line is a weak forbidden line with a peak formation temperature of ~1.5MK. These line is generally too weak to be routinely observed with IRIS. However, using appropriate observation strategies (e.g., longer exposures, lossless compression) it can be observed, at least for dense plasmas. This is the case for instance of the dense upper transition region of hot coronal loops (moss), as shown by Testa et al., 2016, ApJ, 827, 99 .
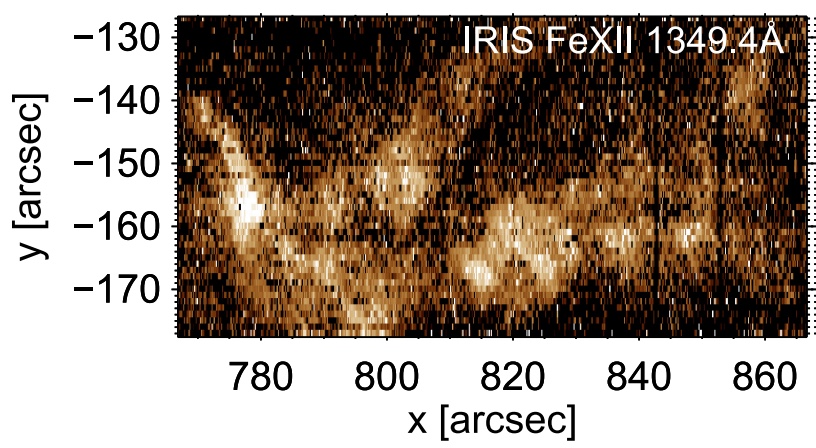
Figure 3.5. Fe XII 1349.4Å line intensity map for an active region ( from Testa et al., 2016, ApJ, 827, 99).
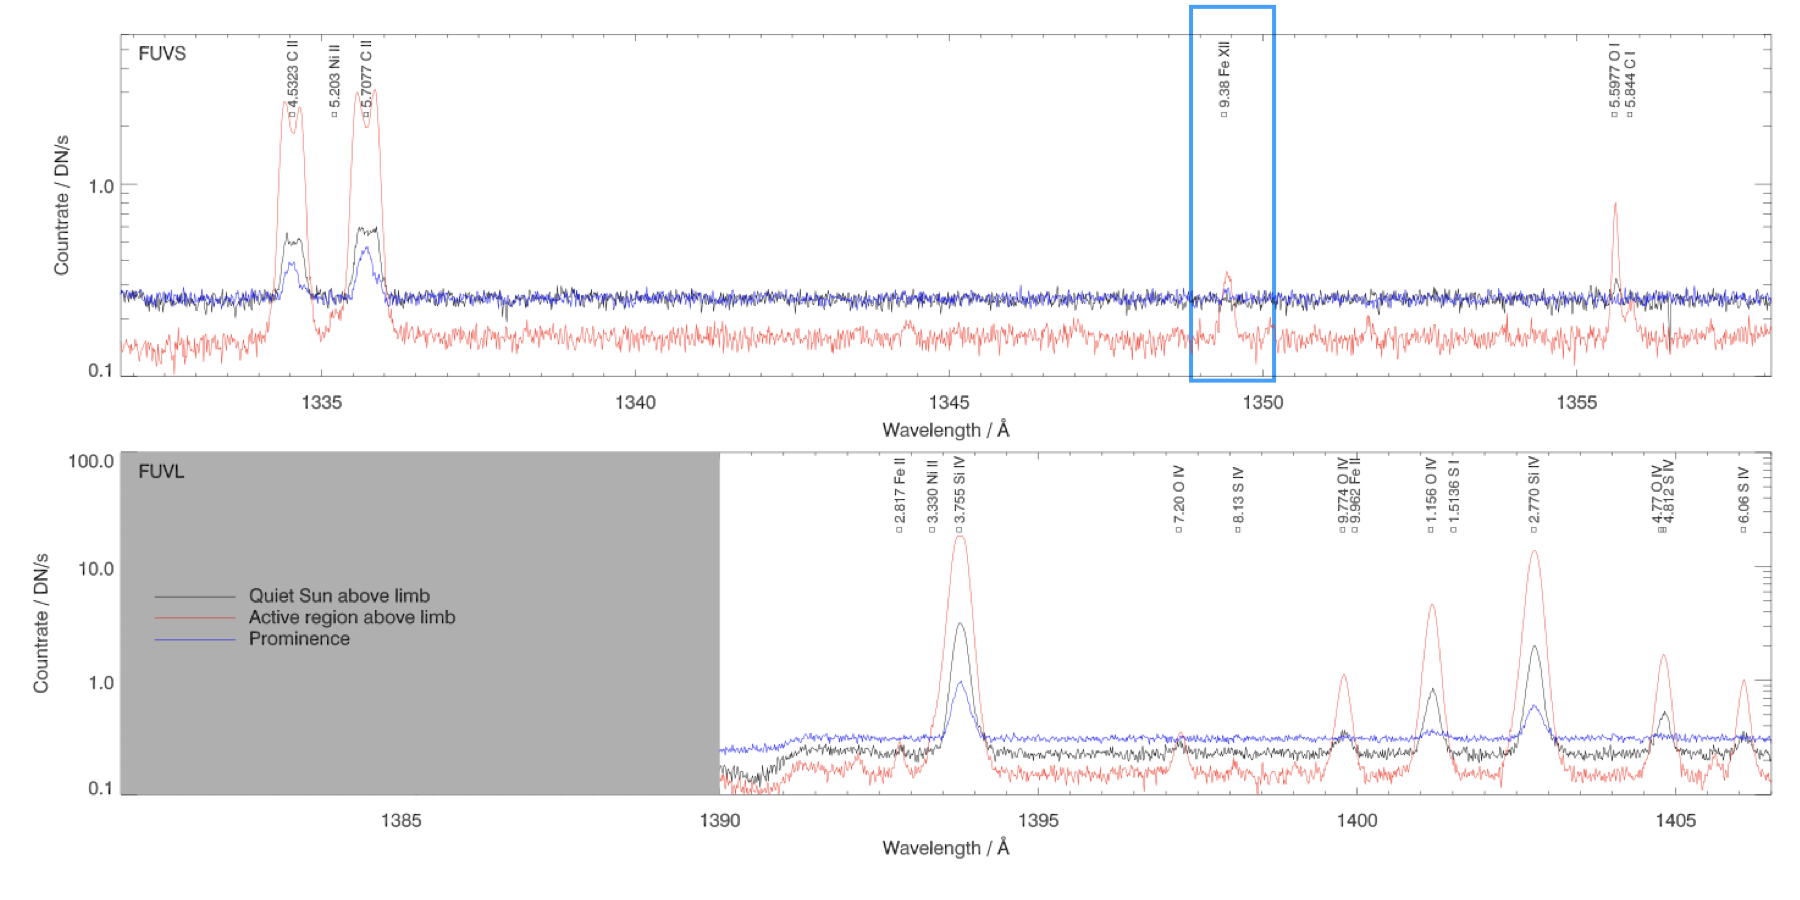
Figure 3.6: Example of Fe XII 1349.4Å emission line (in the blue box) in an IRIS FUV spectrum of an active region above the limb (red line).
3.6. Fe XXI
The IRIS FeXXI 1354.067Å line is a hot (peak formation temperature of ~11MK) coronal line that can be observed during flares:
- above loop top (reconnection region): ~200 km/s red shift (Tian et al. 2014)
- in post-flare loops: emission often strong, zero or small Doppler shift; oscillations detected (Tian et al. 2016)
- at loop footpoints (at or near ribbons): entirely blueshifted by up to ~300 km/s (e.g., Young et al., 2015, ApJ, 799, 218; Li et al. 2015, ApJ, 811, 7; Polito et al. 2015, ApJ, 803, 84 ; Graham & Cauzzi 2015, ApJ, 807, 22)
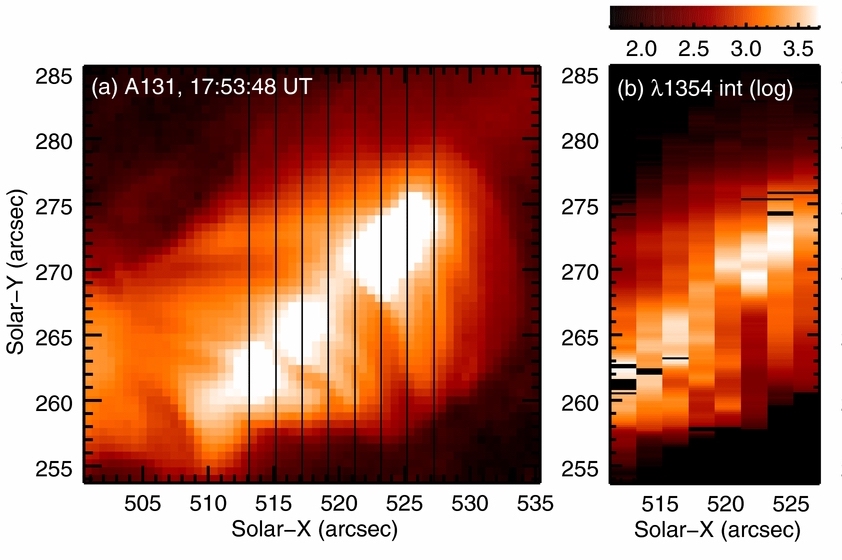
Figure 3.7. Fe XXI 1354.07Å line intensity map for a flare (right panel), compared with emission observed by SDO/AIA in the 131Å passband which is also sensitive to FeXXI emission ( from Young et al., 2015, ApJ, 799, 218).
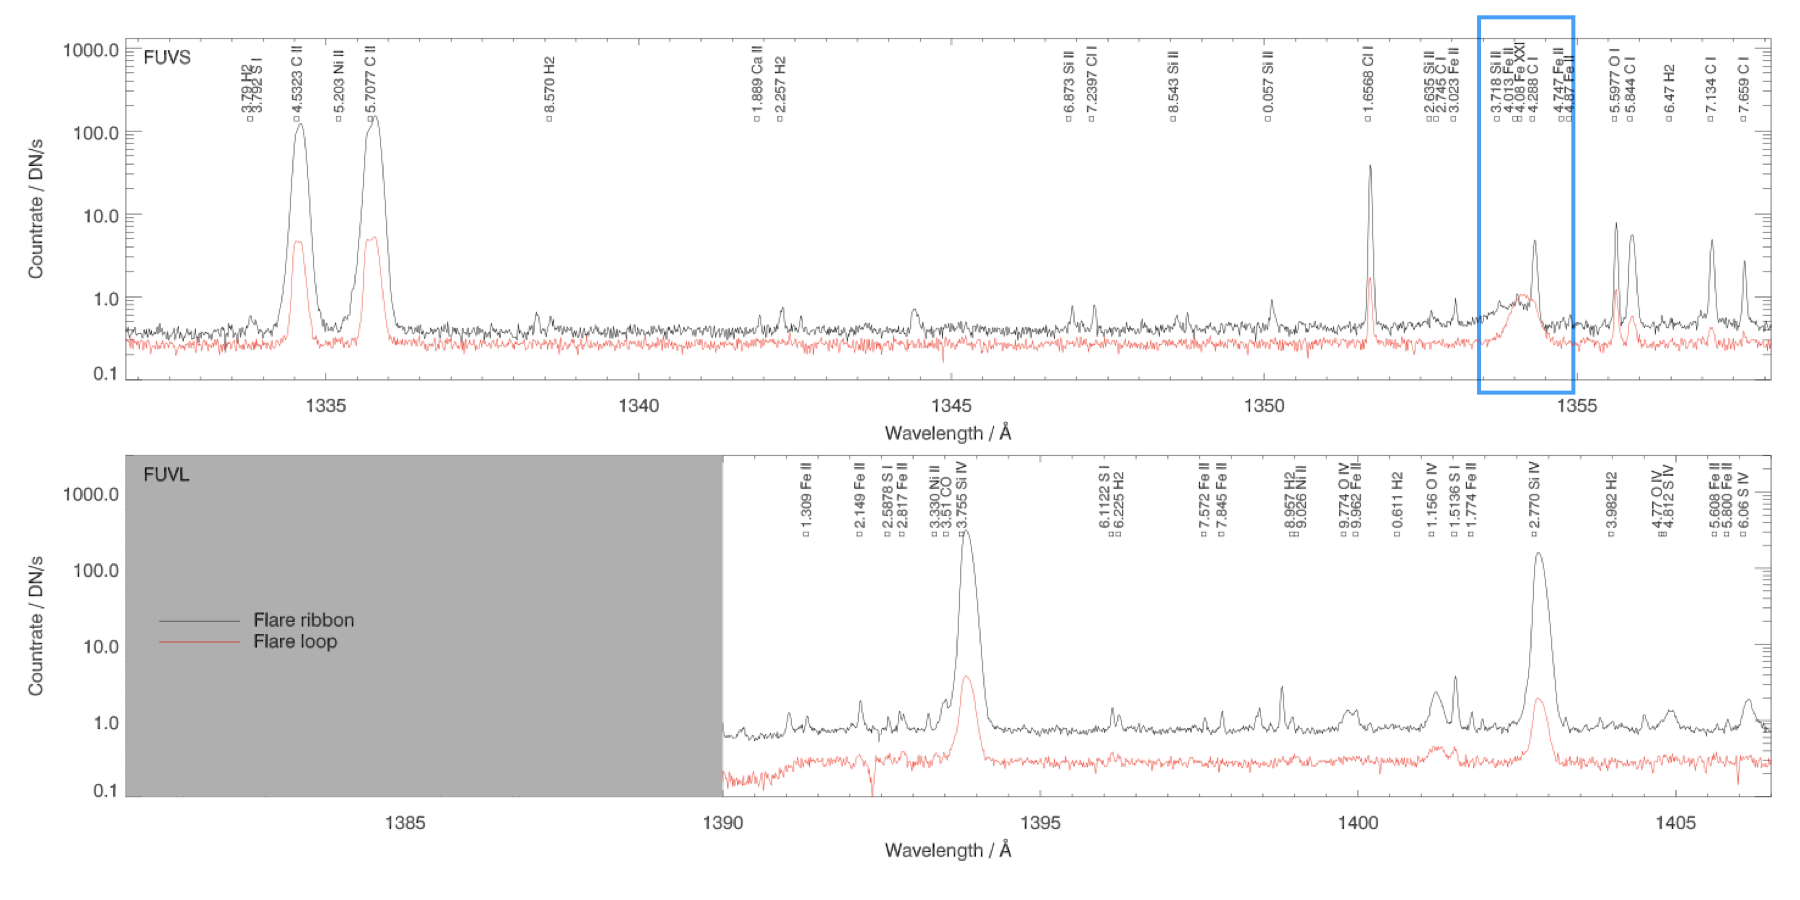
Figure 3.8: Example of Fe XXI 1354.07Å emission line (in the blue box) in IRIS FUV spectra of a flare: the broad Fe XXI line is visible both in the flare ribbons (black line), and in the flare loop (red line).